
Obesity develops over a lifetime. Age matters.
Statewide, obesity prevalence among children ages 2 to 17 was 14.8%. Childhood obesity rates were lowest among 2 to 5 year olds (10.0%), and highest among 12 to 17 year olds (17.9%). Adults ages 18 and over had an obesity prevalence of 41.2%. Obesity rates were progressively higher among older age groups, until they leveled out in middle age. Adult obesity rates were lowest among young adults ages 18 to 24 (22.4%), and highest among adults between ages 45 and 74. Obesity prevalence was lower among the oldest age group, ages 75 and older.
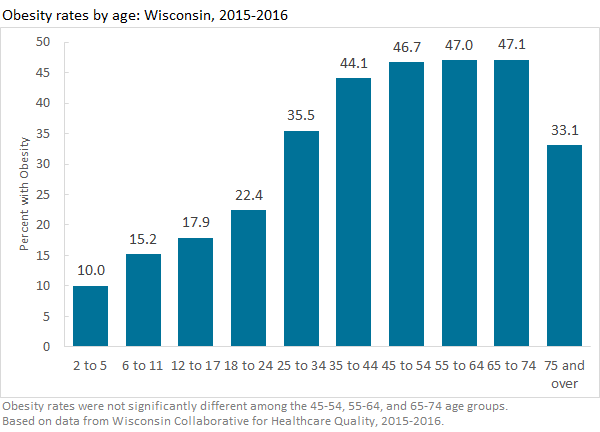
Weight gain happens over a lifetime. Prenatal issues such as maternal weight gain, gestational diabetes, and high or low birthweight can impact weight and obesity among both infants and mothers.1,2 Children today are three times more likely to have obesity than children were in the 1960’s and 70’s.3 Across childhood and early adulthood, we see obesity rates are higher among older age groups. Obesity rates continue to climb until middle age. Lower obesity rates among patients ages 75 and over may be due to shorter life expectancies among those with obesity.


Healthy Weight for All Ages
Strategies to prevent obesity need to address all of the places that people spend their time to make sure those environments support healthy eating and physical activity, starting from birth. That includes the places we grow, play, learn, live, and work. There are many strategies to prevent obesity at all ages, and many groups throughout Wisconsin are already hard at work making their communities healthier.
Settings for Obesity Prevention can Include:
Hospitals
Child Care & Early Education
Schools
Workplaces
Restaurants & Stores
Places of Worship
Neighborhoods
Government Facilities
Explore by ZIP Code
Click a ZIP Code on the interactive map below to view obesity rate estimates by age group. Scroll down for help using the mapping tool.
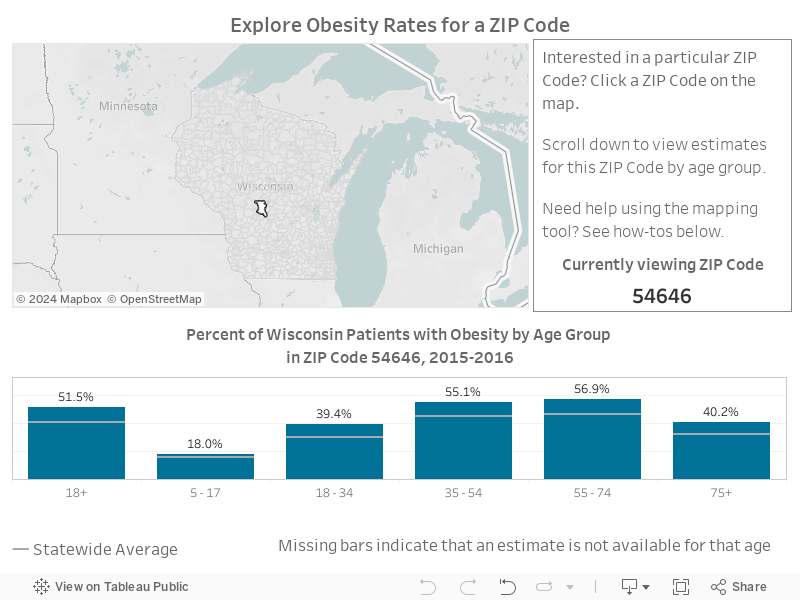
+ Click here for more map tool help.
- Hover over the map to view map controls in the top left
- Hover over a ZIP Code to view more information.
- Hold shift, click and drag to pan map.
References
Leddy MA, Power ML, Schulkin J. The impact of maternal obesity on maternal and fetal health. Rev Obstet Gynecol. 2008;1(4):170-178. doi:10.1111/ajo.12253.
Gregor L, Remington PL, Lindberg S, Ehrenthal D. Prevalence of Pre-pregnancy Obesity, 2011-2014. WMJ. 2016;115(5):228-232. http://www.ncbi.nlm.nih.gov/pubmed/29095583.
Fryar CD, Carroll MD, Ogden CL. Prevalence of Overweight and Obesity Among Children and Adolescents: United States, 1963–1965 Through 2011–2012. Natl Cent Heal Stat. 2014;(September):1963-1965. http://www.cdc.gov/nchs/data/hestat/obesity_child_11_12/obesity_child_11_12.pdf.